
Since Monday (May 20), Josh Willingham is 5-for-15 with three home runs and five RBI. You may be asking, “What does this have to do with buy or sell?” If you read part one of this series, you would have seen that I recommended to go get and/or hold on to Willingham. It’s cool if you’re late to the part, because here are few more buy or sell candidates who can improve your team.
All stats are through May 22.
Brett Lawrie: Sell
|
YEAR |
PA |
R |
HR |
RBI |
SB |
AVG |
OBP |
SLG |
BABIP |
|
2013 |
133 |
9 |
4 |
11 |
0 |
.180 |
.241 |
.336 |
.205 |
|
2012 |
536 |
73 |
11 |
48 |
13 |
.273 |
.324 |
.405 |
.311 |
|
2011 |
171 |
26 |
9 |
25 |
7 |
.293 |
.373 |
.580 |
.318 |
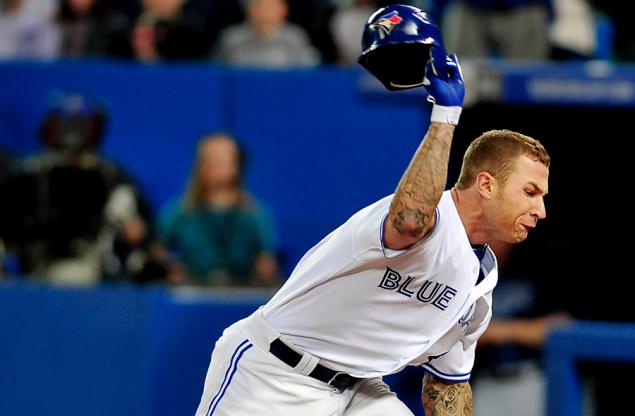
Since the beginning of the 2012 season (661 plate appearances), Brett Lawrie has a slash line of .257/.309/.394, a far cry from the projections fantasy owners forecasted after his rookie season. So what’s the cause for Brett Lawrie’s poor start to the season? He is striking out too often (24 percent of the time), but it’s not from swinging at bad pitches. According to PITCHf/x data, he’s swinging at exactly the same number of pitches outside the zone. Instead, it’s fastballs within the strike zone that he’s swinging and missing on (22 percent of the time). In his first two major league seasons, he has a batting average of .365 against fastballs in the strike zone; this year it’s only .297.
The biggest adjustment pitchers have made this year is they’re throwing the fastball down in the zone, one of his weak spots. A problem I’m seeing with his swing is he moves his body toward the pitcher as the pitch comes toward him. As he does this his head moves toward the mound, which makes a 92 mph fastball look like 97 mph. Since he plays with so much #WANT, he’s prone to extended slumps. Specifically, he tries to hit a home run every time he starts off a game 0-3.1 I was never a Brett Lawrie “guy” because his ADP (82 in NFBC) was too high for a player who hasn’t consistently provided the numbers to be that high of a draft pick. I wouldn’t have a problem if a fantasy owner dropped him in 10-12 mixed leagues, but if you used a seventh-ninth round pick on him, you have to bench him and hope he can make the necessary adjustments to reach the ceiling of his talent level.
Victor Martinez: Buy
|
YEAR |
PA |
R |
HR |
RBI |
SB |
AVG |
OBP |
SLG |
BABIP |
|
2013 |
185 |
11 |
2 |
21 |
0 |
.217 |
.270 |
.301 |
.234 |
|
2011 |
595 |
76 |
12 |
103 |
1 |
.330 |
.380 |
.470 |
.343 |
|
2010 |
538 |
64 |
20 |
79 |
1 |
.302 |
.351 |
.493 |
.303 |
The data points in the table above are only a snapshot of the statistics I use to evaluate players.2 Other than the traditional baseball card statistics, the first stat I look at is BABIP.3 It’s extremely reductive to see a low BABIP and immediately assume it should regress back to the player’s mean. More times than not there indicators as to why a player’s BABIP is vastly higher or lower.
This is Martinez’s first season back after missing all of the 2012 season with a torn ACL. His power is being suppressed by an extremely low 3.3 percent HR/FB rate. He’s hitting 17 percent more fly balls than his career average, and he’s hitting less pop ups (i.e., less weak contact), which indicates he should start hitting for more power. Overall, his contact rates are essentially the same, and his swing-and-miss rates have increased one percentage point compared to his last two full seasons. So, if all the peripherals are the same, what could be causing the low BABIP? The fastball. He’s having trouble hitting the inside fastball against lefties and the outside fastball from righties. This could be an indicator of a decline in bat speed or simply bad luck. I’m buying Martinez for one simple reason: He’s 11th in the league with plate appearances with runners on base. Suppose he hits .275 the rest of the year, he’s going to drive in 100 runs with Miguel Cabrera and Prince Fielder hitting ahead of him. He’s not going to provide the 20-25 home runs he hit in his prime, but he can certainly hit 10-15.
Miguel Montero: Push
|
YEAR |
PA |
R |
HR |
RBI |
SB |
AVG |
OBP |
SLG |
BABIP |
|
2013 |
173 |
13 |
3 |
14 |
0 |
.189 |
.283 |
.264 |
.216 |
|
2012 |
553 |
65 |
18 |
86 |
1 |
.282 |
.351 |
.469 |
.362 |
|
2011 |
573 |
65 |
15 |
88 |
0 |
.286 |
.391 |
.438 |
.317 |
Montero was one of the safest catchers in the preseason because he was money in the bank for 15 home runs, 80 RBI, 60 runs and a .280+ batting average. Because of his consistency he was the eighth and seventh catcher taken in ESPN and NFBC leagues, respectively. Consistency is one of the biggest attributes fantasy owners overlook the most. Consistency is just as sexy as Delmon Young’s defense or Ned Yost’s tactical decisions at the end of game.
The biggest red flag with Montero is the ground-ball rate, which is nearly 19 percent higher than his career. The increased ground ball rate is coming on off-speed pitches from right handed pitchers. This year, he’s seeing nine percent less fastballs (from righties) and more breaking stuff; his batting average against righties is .170 this year compared to .300 the three seasons prior. Montero’s approach is the same as last year, which means he’ll turn it around. Also, Montero still hits in one of the best hitters parks in the National League and plays in the worst division in baseball. What worries me the most is his position in the batting order. The last few games he’s batted at the bottom of the lineup instead of the fourth or fifth spot. Even if he starts to rebound, there’s no guarantee he’ll reclaim his spot in the batting order because the Diamondbacks have a lot of options. Lastly, if you’re in one-catcher leagues, I have no issue with dropping him.
Yoenis Cespedes: Push
|
YEAR |
PA |
R |
HR |
RBI |
SB |
AVG |
OBP |
SLG |
BABIP |
|
2013 |
149 |
22 |
9 |
22 |
1 |
.212 |
.282 |
.462 |
.209 |
|
2012 |
540 |
70 |
23 |
82 |
16 |
.292 |
.356 |
.505 |
.326 |
Cespedes missed 14 games this year with a strained muscle in his left hand after sliding awkwardly into second base while attempting to steal a base. Obviously the hand is very important to hitting, and I don’t know how much it could be affecting his swing (if at all). For the sake of my analysis, I’m assuming it’s not affecting him.4 He’s striking out 25 percent more than last year, and he’s seeing seven percent less pitches in the strike zone, indicating he’s expanding the strike zone. Pitchers are attacking Cespedes up in the zone 15 percent more than last year. Throughout his brief major-league career, he’s had trouble with that part of the strike zone; last year he hit .185 and this year he’s hitting .143.
Due to Cespedes’ max-effort swing, his ability to hit the ball in every quadrant of the strike zone has made him one of the most aggressive hitters in the league. Last year he was 20th in swing-and-miss rate; this year he’s 34th. I projected him as a top 15 outfielder in the preseason, and at the end of the year, I’ll probably be wrong. However, he definitely finishes the year as a top 30 outfielder because he’ll consistently bat in the middle of the Athletics order, has the raw power to hit 30+ home runs and the speed to turn more ground balls into infield hits, which should provide a .270+ batting average.
Jacoby Ellsbury: Sell
|
YEAR |
PA |
R |
HR |
RBI |
SB |
AVG |
OBP |
SLG |
BABIP |
|
2013 |
217 |
25 |
1 |
14 |
13 |
.249 |
.318 |
.340 |
.281 |
|
2012 |
323 |
43 |
4 |
26 |
14 |
.271 |
.313 |
.370 |
.304 |
|
2011 |
732 |
119 |
32 |
105 |
39 |
.321 |
.376 |
.552 |
.336 |
With an average ADP of 36 in NFBC leagues, Ellsbury’s fantasy owners were banking on a season similar to 2011. Instead, they’re getting a season more comparable to Juan Pierre than Matt Kemp. With a quarter of the season in the books, it looks as though Ellsbury’s 2011 season, in regards to his power, may be the same statistical outlier as Brady Anderson’s 1996 season. If you remove his 2011 season from his career numbers, he only has 25 home runs in 1,969 plate appearances. With a HR/FB rate of 1.9 percent, Ellsbury is bound to see a positive regression back to his statistical mean, but 25+ home runs is not going to happen. He’s hitting ground balls 52.3 percent of the time, which puts him in the same class as Ichiro Suzuki, Denard Span and Alcides Escobar. Other than power, all of his other peripherals are better. He’s striking out less, walking more and swinging and missing left often. If you can get 70-80 cents on the dollar for him I would make that deal in heartbeat.
1. Thank you to the Towers of Power Podcast for this insight.
2. It’s very important to watch games, because I use the data to affirm on the trends I’m seeing on the field.
3. That’s if I see an unusually high or low batting average.
4. I haven’t found any information that it is affecting him.


