Jason Kipnis
Bats: L | Age: 27 | Team: Indians | Position: 2B | Player Rater Positional Values: ESPN (2), NFBC (1)
For two years in a row, Jason Kipnis has begun the season red hot and completely faded away during the second half. The table below shows his first and second half performances the last two seasons.
| PA | AVG | OBP | SLG | HR | SB | CS | RBI | Runs | |
| First Half | 744 | .289 | .409 | .466 | 24 | 41 | 6 | 106 | 106 |
| Second Half | 586 | .247 | .375 | .349 | 7 | 20 | 8 | 54 | 66 |
Last year, I wasn’t buying Kipnis because his 2012 season benefitted greatly from the first half of season, and I believed the reason he struggled was his inability to adjust the adjustments the league made. Specifically, he struggled against fastballs up in the zone and breaking stuff down in the zone. Those struggles contributed to his strikeout rate increasing two percentage points and his in-play rate decreasing five percentage points.
Last year, his BABIP increased from .291 to .345, fueling the batting-average increase. The reason for the substantial increase in his BABIP from 2012 to 2013 came against left-handed pitching. Last year, he hit .308 with a .390 BABIP, while in 2012 he hit .215 with a .251 BABIP. The samples are still too low, but the 2012 performance seems more likely to repeat in 2014. Even though I do not expect Kipnis to hit .308 against lefties again, he will probably hit in the .230-.250 range. None of this explains his poor second half, though.
In the first half of the year, he hit .301 with a .361 BABIP and was only putting 38 percent of balls in play. In the second half of the year, he hit .261 with a .326 BABIP and put 44 percent of balls in play. Normally, when I see BABIPs decreasing while in-play rates increase, my first inclination is to think the hitter was hitting more ground balls. Kipnis did, in fact, hit more ground balls, but it was only one percentage point higher. It looks as though Kipnis just got unlucky and suffered the cruise from the BABIP monster.
The biggest concern I have about Kipnis’ game when comparing his performance in 2012 to 2013 is the strikeout rate increasing five and half percentage points and the in-play percentage decreasing from 45.1 percent to 40.8 percent. What’s extremely encouraging is the number of doubles almost doubled, which implies there could be room for more power.
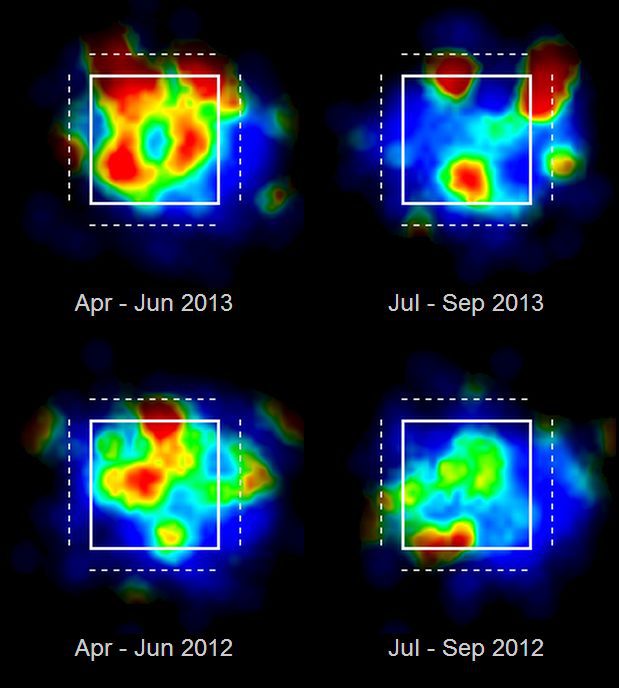
The second base position is extremely shallow, which will explain why most fantasy experts have him as their second or third second baseman, but I’m skeptical of the batting average regressing to the .260 range and the stolen base attempts decreasing. Despite having a substantially higher OBP in 2013, his stolen-base attempts were identical to 2012. If his OBP drops back to the .340 range, will he steal 30 bags again? Lastly, if you want to get geeky, the screenshot below visually shows his slugging percentage by each half of the year the past two years. Image courtesy of TruMedia Networks.