The matchups and statistical data were pulled Saturday morning. Please be aware the matchups are subject to change.
Top starters
|
Rank |
Name |
Team |
Opp. |
ERA |
K% |
BB% |
|
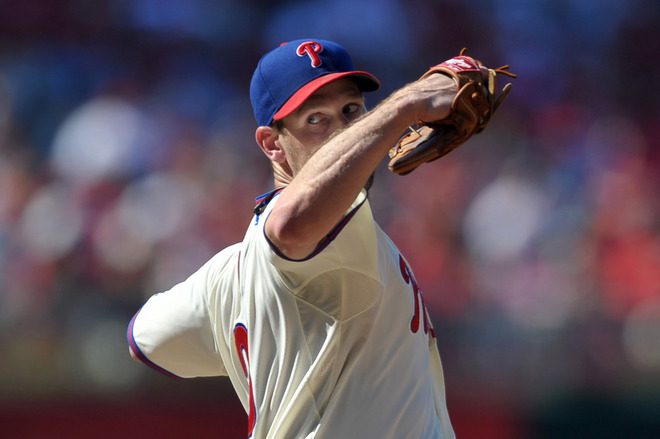
1 |
Cliff Lee |
PHI |
@NYM, @CHC |
3.16 |
23.2% |
4.0% |
|
2 |
Zack Greinke |
LAD |
CHC, SD |
2.91 |
18.9% |
6.8% |
|
3 |
Hisashi Iwakuma |
SEA |
TEX, @HOU |
2.98 |
21.3% |
4.7% |
|
4 |
Clayton Kershaw |
LAD |
CHC |
1.72 |
25.0% |
5.7% |
|
5 |
Chris Sale |
CWS |
HOU |
3.08 |
25.9% |
5.3% |
|
6 |
Matt Harvey |
NYM |
PHI |
2.25 |
28.4% |
4.7% |
|
7 |
Yu Darvish |
TEX |
MIN |
2.68 |
33.2% |
8.5% |
|
8 |
Max Scherzer |
DET |
OAK |
2.82 |
28.1% |
5.8% |
|
9 |
Hiroki Kuroda |
NYY |
@TOR |
2.71 |
17.9% |
4.5% |
|
10 |
Adam Wainwright |
STL |
CIN |
2.58 |
23.5% |
3.2% |
|
11 |
Stephen Strasburg |
WSH |
MIA |
3.00 |
26.0% |
7.5% |
|
12 |
Jose Fernandez |
MIA |
@ATL |
2.41 |
27.0% |
8.8% |
|
13 |
Julio Teheran |
ATL |
MIA |
2.96 |
21.2% |
5.5% |
|
14 |
Mike Minor |
ATL |
MIA |
3.06 |
22.9% |
5.7% |
|
15 |
Cole Hamels |
PHI |
@NYM |
3.62 |
21.4% |
5.7% |
|
16 |
David Price |
TB |
LAA |
3.29 |
20.3% |
3.6% |
|
17 |
Felix Hernandez |
SEA |
TEX |
2.63 |
26.2% |
5.3% |
Additional Information: Surprisingly, the Oakland Athletics have the 13th-lowest strikeout rate in baseball; they had the 28th highest last year. I expect Max Scherzer to have a great game, but not the 7.4 strikeouts he’s been averaging this year. Since June, Cliff Lee has a 3.90 ERA, 1.13 WHIP with a 26 percent strikeout rate and only a 3.9 percent walk rate. Other than his ERA, all his other numbers have been extremely good, and it appears his ERA is a function of bad luck as evidenced with a .315 BABIP and 16.9 percent HR/FB rate.
Backend starters
|
Rank |
Name |
Team |
Opp. |
ERA |
K% |
BB% |
|
18 |
Anibal Sanchez |
DET |
OAK, CLE |
2.45 |
26.7% |
7.2% |
|
19 |
C.J. Wilson |
LAA |
@TB, @MIL |
3.30 |
21.0% |
8.8% |
|
20 |
Justin Verlander |
DET |
OAK, CLE |
3.68 |
22.3% |
8.3% |
|
21 |
Zack Wheeler |
NYM |
PHI, @WSH |
3.49 |
20.6% |
10.6% |
|
22 |
Gio Gonzalez |
WSH |
MIA |
3.66 |
23.7% |
9.7% |
|
23 |
Shelby Miller |
STL |
@PIT |
2.98 |
26.5% |
7.5% |
|
24 |
Jered Weaver |
LAA |
@MIL |
3.62 |
19.3% |
6.1% |
|
25 |
Matt Garza |
TEX |
MIN |
3.59 |
21.1% |
6.0% |
|
26 |
A.J. Burnett |
PIT |
STL |
3.09 |
26.0% |
8.6% |
|
27 |
Francisco Liriano |
PIT |
STL |
2.53 |
25.5% |
9.5% |
|
28 |
Jeff Samardzija |
CHC |
PHI |
4.12 |
23.4% |
8.8% |
|
29 |
Derek Holland |
TEX |
@SEA |
2.95 |
22.5% |
7.2% |
|
30 |
Mat Latos |
CIN |
@STL |
2.93 |
23.4% |
6.9% |
|
31 |
Patrick Corbin |
ARI |
SF |
2.46 |
21.8% |
6.1% |
|
32 |
Alex Cobb |
TB |
@OAK |
2.85 |
22.4% |
7.5% |
|
33 |
Ervin Santana |
KC |
@TOR |
3.13 |
19.2% |
5.9% |
|
34 |
Doug Fister |
DET |
OAK |
3.54 |
17.7% |
4.7% |
|
35 |
Jordan Zimmermann |
WSH |
NYM |
3.37 |
18.2% |
5.0% |
|
36 |
Homer Bailey |
CIN |
@STL |
3.71 |
23.9% |
5.6% |
|
37 |
Jarrod Parker |
OAK |
@DET |
3.71 |
17.2% |
8.0% |
|
38 |
Ricky Nolasco |
LAD |
CHC |
3.42 |
19.0% |
5.7% |
Additional Information: At the beginning of the year, I never would’ve thought I would seriously consider ranking Zack Wheeler over Justin Verlander in a two-start week, but I stared at my computer screen for 10 minutes before I eventually went with Verlander. The big question: Is Verlander a top 10 fantasy starting pitcher next year? Probably not. Speaking of Wheeler, I’m streaming almost every pitcher who’s facing teams in the NL East not named the Atlanta Braves, which explains the Jeff Samardzija ranking as well. In his last 10 starts, longtime favorite of mine, Jordan Zimmerman has a 5.53 ERA, 1.46 WHIP, 18.4 percent strikeout rate and 7.4 percent walk rate. Though 7.4 percent may not seem a lot, since 2011 he has a 5.0 percent walk rate. I would’ve ranked Zimmerman lower, but a start against the Mets is too good to pass up.
Spot starters
|
Rank |
Name |
Team |
Opp. |
ERA |
K% |
BB% |
|
39 |
Alex Wood |
ATL |
CLE, MIA |
2.50 |
26.6% |
7.0% |
|
40 |
Danny Salazar |
CLE |
@ATL, @DET |
3.52 |
32.2% |
7.8% |
|
41 |
James Shields |
KC |
@MIN, @TOR |
3.22 |
19.2% |
7.4% |
|
42 |
Gerrit Cole |
PIT |
MIL, STL |
3.81 |
18.1% |
5.4% |
|
43 |
Kyle Lohse |
MIL |
@PIT, LAA |
3.22 |
16.3% |
5.0% |
|
44 |
Nathan Eovaldi |
MIA |
@WSH, @ATL |
3.82 |
16.4% |
9.7% |
|
45 |
Jose Quintana |
CWS |
HOU |
3.67 |
19.8% |
6.8% |
|
46 |
Scott Feldman |
BAL |
@NYY |
3.94 |
17.4% |
6.7% |
|
47 |
Chris Archer |
TB |
LAA |
2.93 |
17.1% |
8.3% |
|
48 |
Sonny Gray |
OAK |
TB |
1.44 |
28.4% |
7.4% |
|
49 |
Erasmo Ramirez |
SEA |
@HOU |
5.95 |
19.1% |
6.4% |
|
50 |
Dillon Gee |
NYM |
@WSH |
3.60 |
17.5% |
6.0% |
|
51 |
Andrew Cashner |
SD |
@LAD |
3.74 |
16.3% |
7.4% |
|
52 |
Jake Peavy |
BOS |
CWS |
4.25 |
21.6% |
5.0% |
|
53 |
Travis Wood |
CHC |
@LAD |
3.22 |
17.3% |
8.1% |
|
54 |
Hyun-Jin Ryu |
LAD |
SD |
2.95 |
19.8% |
7.1% |
|
55 |
Joe Kelly |
STL |
CIN |
3.01 |
16.2% |
8.7% |
|
56 |
Justin Masterson |
CLE |
@ATL |
3.51 |
24.0% |
9.2% |
|
57 |
Rick Porcello |
DET |
CLE |
4.52 |
18.3% |
5.3% |
|
58 |
Kris Medlen |
ATL |
CLE |
3.74 |
17.9% |
5.9% |
|
59 |
Todd Redmond |
TOR |
KC |
4.43 |
24.9% |
7.5% |
|
60 |
Ethan Martin |
PHI |
@NYM |
5.22 |
23.2% |
10.5% |
|
61 |
Lance Lynn |
STL |
@PIT |
3.97 |
22.5% |
9.0% |
|
62 |
John Lackey |
BOS |
BAL |
3.17 |
21.4% |
5.3% |
|
63 |
Madison Bumgarner |
SF |
@COL |
2.84 |
23.8% |
7.9% |
|
64 |
Dan Haren |
WSH |
NYM |
4.64 |
20.8% |
4.1% |
Additional Information: I’ve said this in previous rankings, but it’s worth mentioning again: If you’re looking for wins, then Scott Feldman, Rick Porcello and Jake Peavy are excellent candidates for fantasy owners because they pitch for high-powered offenses that are likely to earn wins, even though they go six innings and allow three runs. Like last year, Lance Lynn was extremely dominant to begin the season, but has hit the wall. In his first eight starts, he had a 2.88 ERA and 1.08 WHIP with a 26.5 percent strikeout rate and 10.3 percent walk rate. However, in his 18 starts, he has 4.46 ERA, 1.36 WHIP, 20.8 percent strikeout rate ad 8.4 percent walk rate. These numbers indicate he’s become more hittable, which he has. If you’re looking for a pitcher to not affect your ratios, then Lynn is not a good start.
Proceed with caution
|
Rank |
Name |
Team |
Opp. |
ERA |
K% |
BB% |
|
65 |
Jon Niese |
NYM |
PHI, @WSH |
4.03 |
16.7% |
8.8% |
|
66 |
Wade Miley |
ARI |
SD |
3.60 |
17.6% |
8.0% |
|
67 |
Eric Stults |
SD |
@LAD |
3.70 |
15.0% |
5.1% |
|
68 |
Randall Delgado |
ARI |
SF |
3.82 |
17.2% |
5.0% |
|
69 |
Ivan Nova |
NYY |
BAL |
3.17 |
22.3% |
6.8% |
|
70 |
Ubaldo Jimenez |
CLE |
@ATL |
3.95 |
22.6% |
12.4% |
|
71 |
Felix Doubront |
BOS |
BAL |
3.79 |
20.2% |
9.6% |
|
72 |
R.A. Dickey |
TOR |
NYY |
4.49 |
18.3% |
7.9% |
|
73 |
Bruce Chen |
KC |
@MIN |
2.88 |
16.7% |
7.7% |
|
74 |
Paul Maholm |
ATL |
CLE |
4.51 |
15.9% |
7.2% |
|
75 |
Brandon McCarthy |
ARI |
SD, SF |
5.44 |
14.4% |
4.7% |
|
76 |
Jarred Cosart |
HOU |
@CWS, SEA |
1.60 |
11.9% |
11.9% |
|
77 |
CC Sabathia |
NYY |
BAL |
4.83 |
19.7% |
6.6% |
|
78 |
Ryan Dempster |
BOS |
BAL, CWS |
4.77 |
20.5% |
10.0% |
|
79 |
Jon Lester |
BOS |
CWS |
4.09 |
19.2% |
7.5% |
|
80 |
Wei-Yin Chen |
BAL |
@BOS, @NYY |
3.19 |
15.6% |
6.4% |
|
81 |
Jacob Turner |
MIA |
@ATL |
3.02 |
15.3% |
10.5% |
|
82 |
Tony Cingrani |
CIN |
@COL |
2.76 |
28.6% |
10.0% |
|
83 |
Jake Arrieta |
CHC |
@LAD, PHI |
5.75 |
20.7% |
14.5% |
|
84 |
Jeff Locke |
PIT |
MIL |
3.01 |
17.4% |
11.8% |
|
85 |
Chris Tillman |
BAL |
@BOS |
3.79 |
19.7% |
8.7% |
Additional Information: Jon Niese has a 2.62 ERA and 1.36 WHIP in his last nine starts. Now, the WHIP indicates he’s been lucky with his ERA, but with two starts against the NL East, his run of good luck will continue. Despite the discrepancy in home-road splits for Eric Stults, I still love his matchup in Dodger Stadium, one of the five best pitchers parks in the majors. On Tuesday, Tony Cingrani left his start after only 3.2 innings with a lower back strain. He says he’ll be ready for his next start, but even if he does pitch, you should leave him on your bench. If you don’t believe me, ask how Francisco Liriano’s owners felt about his start in Colorado two weeks ago. Brandon McCarthy has not looked good in his first four starts back from the DL, but if you’re willing to the roll the dice, he could provide two quality starts against two bad teams; this is a total gut call on my part. R.A. Dickey in his last six starts has been very solid with a 3.67 ERA, 1.20 WHIP, 21 percent strikeout rate and 6.3 walk rate. Combine that with a start against the below-average Yankees lineup, you could do a lot worse this far into the list.
Avoid
|
Rank |
Name |
Team |
Opp. |
ERA |
K% |
BB% |
|
86 |
Chris Capuano |
LAD |
SD |
4.70 |
16.8% |
5.3% |
|
87 |
Martin Perez |
TEX |
@SEA |
3.62 |
15.8% |
6.9% |
|
88 |
Trevor Cahill |
ARI |
SD |
4.55 |
17.0% |
9.4% |
|
89 |
Edwin Jackson |
CHC |
@LAD |
5.00 |
17.7% |
7.8% |
|
90 |
Henderson Alvarez |
MIA |
@WSH |
3.86 |
13.2% |
6.6% |
|
91 |
Roberto Hernandez |
TB |
LAA, @OAK |
4.97 |
16.9% |
5.1% |
|
92 |
Andre Rienzo |
CWS |
HOU, @BOS |
3.56 |
16.0% |
10.7% |
|
93 |
Jason Vargas |
LAA |
@MIL |
3.92 |
15.6% |
7.8% |
|
94 |
Samuel Deduno |
MIN |
KC |
3.69 |
14.1% |
9.0% |
|
95 |
Aaron Harang |
SEA |
@HOU |
5.49 |
16.1% |
5.2% |
|
96 |
Andrew Albers |
MIN |
KC |
3.00 |
9.8% |
2.7% |
|
97 |
Andy Pettitte |
NYY |
@TOR |
4.26 |
15.8% |
6.2% |
|
98 |
Yovani Gallardo |
MIL |
@PIT |
4.61 |
17.7% |
8.9% |
|
99 |
Tom Gorzelanny |
MIL |
@PIT |
3.60 |
23.6% |
9.1% |
|
100 |
Mike Leake |
CIN |
@STL, @COL |
3.12 |
14.6% |
5.9% |
|
101 |
Travis Blackley |
TEX |
@SEA, MIN |
4.85 |
18.6% |
12.6% |
Additional Information: When I’m choosing between pitchers this low on the list, I look for a reasonable strikeout rate, a low walk rate and an above-average matchup. This is why Chris Capuano leads this tier of pitchers. Since July, in eight starts, Edwin Jackson has a 3.40 ERA, 1.21 WHIP, 14.1 percent strikeout rate and 7.3 percent walk rate. The walk and strikeout rates indicate Jackson hasn’t been as dominant, which is why he’s this far down. But at the end of the day, he’s pitching in Dodger Stadium and has the ability to miss a ton of bats when everything is working.