After my first buy or sell piece, I received a lot of requests from readers about other players they would like more information about. I’ve heard you loud and clear. Below is part two in my series. Tomorrow, I’ll be reviewing Victor Martinez, Brett Lawrie, Yoenis Cespedes, Miguel Montero and maybe Jacoby Ellsbury.
All stats are through May 20.
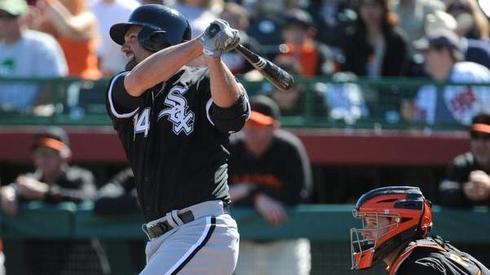
Paul Konerko: Push
|
YEAR |
PA |
R |
HR |
RBI |
SB |
AVG |
OBP |
SLG |
BABIP |
|
2013 |
165 |
15 |
4 |
17 |
0 |
.220 |
.279 |
.333 |
.246 |
|
2012 |
639 |
69 |
31 |
105 |
1 |
.300 |
.388 |
.517 |
.312 |
|
2011 |
598 |
66 |
26 |
75 |
0 |
.298 |
.371 |
.486 |
.304 |
In my fantasy guide, a big reason I was down on Paul Konerko heading into the year had nothing to do with a potential decline in his skill set due to his age (he’s 34). I was concerned he wouldn’t have an opportunity to drive in and score runs due to the deficiencies of the construction of the lineup around him and hitting behind Adam Dunn. Dunn is a three-outcome player as he only hits home runs, walks or strikes out; last year, he had one of these outcomes in 57 percent of his at-bats, while the major league average is 29.5 percent. For example, last year, Paul Konerko ranked 60th in majors (among players with at least 300 at-bats) in plate appearances with runners on-base.1 This year he ranks 118th, tied with the likes of Pete Kozma, Ichiro Suzuki and Lorenzo Cain. I can’t say I’m surprised because the White Sox have the thrid lowest OBP in the league with .294. In terms of skill set, it appears his bat speed may have decreased. He’s striking 11 percent of the time on fastballs, the last three years it’s been 9.1 percent. He’s also swinging and missing more on fastballs, 10.1 percent this year compared to 9.3 percent the past three years. On secondary pitches, his BABIP is 12 percent lower than last year, and he’s swinging and missing 20 percent more often, but is putting 9 percent more of those balls play. Basically, it looks like he’s getting unlucky on secondary pitches. Paul Konerko is a better player than he’s shown thus far, but you have a player who will hit .250-260 with 15-20 home runs.
Danny Espinosa: Sell
|
YEAR |
PA |
R |
HR |
RBI |
SB |
AVG |
OBP |
SLG |
BABIP |
|
2013 |
141 |
10 |
3 |
12 |
1 |
.163 |
.191 |
.296 |
.200 |
|
2012 |
658 |
72 |
21 |
66 |
17 |
.236 |
.323 |
.414 |
.333 |
|
2011 |
658 |
82 |
17 |
56 |
20 |
.247 |
.315 |
.402 |
.292 |
At the beginning of last September, Espinosa tore his left rotator cuff and decided to play with the injury instead of getting surgery for the 2013 season. That reason alone is why I buried him on my cheat sheet, because I never want to roster players who are already injured. How many walks does he have so far this year? Three. Espinosa has never been much of a walker, but we’re at Jeff Keppinger levels now. His strikeout rate is one percentage point lower than last year (27 percent), and his contact rates the same as last year, but it’s the type of contact that is a big red flag. Last year, he hit a ground ball 47 percent of the time; this year, it’s 49.5 percent. In general, ground balls produce the lowest likelihood of generating runs compared to fly balls and line drives. So, he has a poor approach at the plate and he’s making the same amount of contact, but it’s a lot weaker, and on top of all that, he has a rotator cuff issue. I’m selling him to anyone who thinks he can turn it around.
Cole Hamels: Buy
|
YEAR |
K |
BB |
ERA |
WHIP |
K% |
BB% |
LOB% |
HR/FB |
BABIP |
|
2013 |
57 |
24 |
4.45 |
1.28 |
21.5 |
9.1 |
73.5 |
13.6 |
.270 |
|
2012 |
216 |
52 |
3.05 |
1.12 |
24.9 |
6.0 |
78.1 |
11.9 |
.290 |
|
2011 |
194 |
44 |
2.79 |
0.99 |
22.8 |
5.2 |
78.4 |
9.9 |
.255 |
The velocity of the fastball and other pitches do not have noticeable change. Even though his strikeout rate is down, his swing-and-miss rate is the highest it’s been since 2008. The quality of his stuff is the same, but his biggest problem has been the walks. This is especially true with men on base. Prior to this year, he’s averaged a walk rate of 6.5 percent with men on base. This year, it’s 11.3 percent. He’s walking more batters with no one base at well, which tells me his problems are mechanical and they can be fixed at any moment. His last start against the Marlins was the best he looked2 in a month. Granted it was against a bad triple-A lineup, but he challenged hitters with his great change-up and generated a lot of swings and misses. I know this is purely revisionist, but if you remove his first two starts of the year, where he allowed 13 earned runs in 10.2 innings, he has a 3.12 ERA, 1.14 WHIP, 23 percent strikeout rate and 8.9 percent walk rate. If the walk rate doesn’t improve, he’s a top-20 starting pitcher instead of a top-10 pitcher.
1. The data is courtesy of Baseball Prospectus.
2. After the first six batters, he started using his secondary pitches more to thwart the aggressiveness of the Marlins hitters as they were looking for and getting first-pitch fastballs in the strike zone.